
This is the legacy 4D documentation web site. Documentations are progressively being moved to developer.4d.com
 Overview
One of the most important tasks in data management is report generation. The Quick Report editor is one of two tools made available by 4D for the purpose of designing reports. You use the Quick Report editor to create ad-hoc reports in the Design and Application environments.
The other tool is the Form editor, which you can use to design reports in the Design environment (which can be altered subsequently in Application mode). You should use an output form to design reports that require complex designs or programmatic processing. This possibility is detailed in the Output forms and reports chapter.
Using the Quick Report editor, you can:
- Produce lists of records
- Create break areas
- Produce cross-table reports
- Compute summary calculations
- Modify fonts and styles in the report
- Define background colors on a cell basis
- Save and open quick report designs to/from disk
- Select different output types such as HTML or text file, printing or saving to disk.
The Quick Report editor can be managed by programming using the commands of the Quick Report theme.
The Quick Report editor contains the following elements:
- Tool bar: Provides access to the main functions for managing reports.

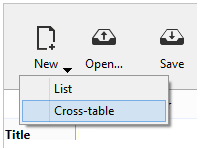
- New...: Creates a new blank quick report design. This button allows you to select the report type: list or cross-table (see below).
- Open: Manages quick report files. These buttons are described in the Managing quick reports section.
- Save: Opens a dialog to save the quick report file.
- Destination: Used to designate the output type for the report. This is described in more detail in the Executing a quick report section.
- Preview: Uses the preview system of your OS to display a print preview of the report.
- Execute: Generates report with the current data in the destination format defined (see Executing a quick report section).
- Clear: Erases all columns and rows of the report design template so that you can start over with a blank window. This button displays a confirmation dialog box.
- Revert: Replaces the current report design with the last version saved to disk. This button is disabled when the design displayed has not been saved in a file on disk.
- Header and Footer: Used to set the header and footer areas of quick reports. These options are described in the Adding headers and footers section.
- Options: Displays the report options window. The options displayed depend on the current output destination of the report.
- Fields: Displays a window listing all the fields of the current table and any related tables on one side, along with all the columns of the report on the other side. You can easily add, move or delete fields in the report (see Defining the report using a fields list).
- Hide bar: You use the vertical arrow button to hide or display the tool bar.
- Report design and preview area: This area lets you build your report design template and insert fields using the (+) button or the pop-up window; you can also adjust the width of columns, add or remove subtotals and formulas, set cell background or text colors, and so on.
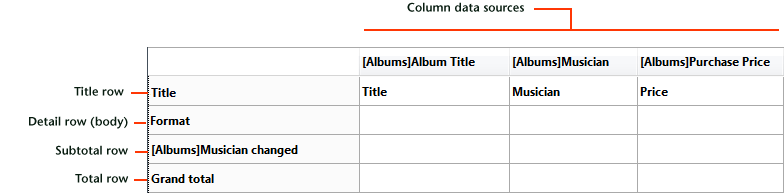
- Title row: Displays the names of fields or formulas that have been inserted into the report. This row is repeated for each page of the report. The Quick Report editor inserts field names by default, but you can modify the contents.
- Format (Detail) row: Contains information drawn from each record and is repeated in the report for each record. You can associate a display format with it, depending on the type of data represented.
- Subtotal row(s): Displays intermediate calculations as well as the wording associated with them. A subtotal row is created for each sort order.
- Column data sources: Indicates the source of the data for each column.
- Pop-up windows and local menus: Provide access to various editor functions, such as modifying cell properties or adding columns.
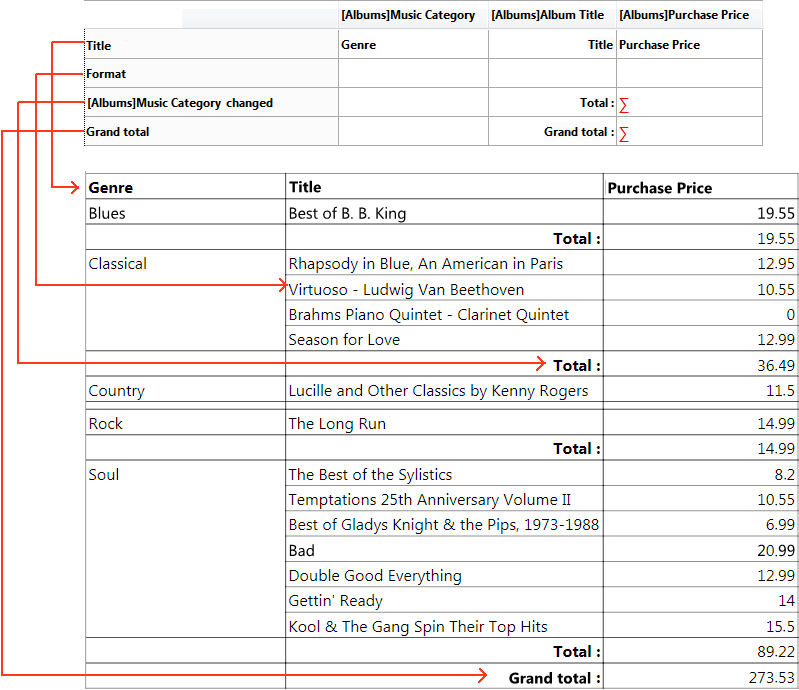
The following diagram illustrates the relationship between the specifications in the design itself and the printed output:
In the Quick Report editor there are two operation modes available that generate two specific types of reports: List and Cross-table.
- List mode
This is the default mode. In this mode, reports typically display records as a list with break levels where sums are performed. The following is a typical List type quick report: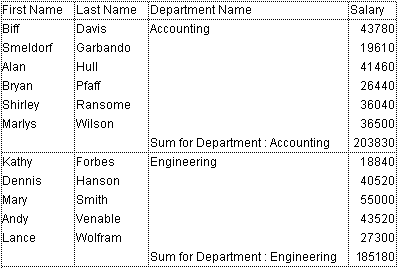
- Cross-table mode
This mode allows you to display your report as a two-dimensional table. This is useful when you want to display data from one data source broken down into categories that are actually a function of two other data sources. For example, a cross-table form would let you display, in a table, how many of each product type was sold in each quarter. The following is a typical Cross-table type quick report: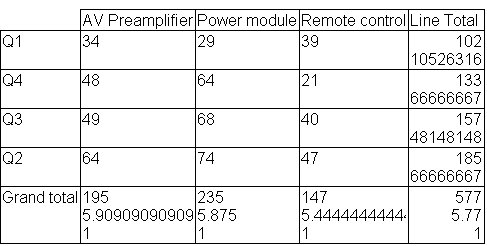

Product: 4D
Theme: Quick reports
Modified: 4D v16 R2
4D Design Reference ( 4D v20 R7)


