
This is the legacy 4D documentation web site. Documentations are progressively being moved to developer.4d.com
 Graphic attributes of a quick report
You can modify the graphic appearance of a quick report. The Quick Report editor lets you set the following attributes:
- the character font, as well as its size, justification, style and color,
- the background color of the cells, as well as an alternate background color.
- the cell borders.
Note: Appearance specifications are only taken into account for the “Printer” and “HTML” output destinations (colors). For more information about report destinations, refer to Executing a quick report.
While designing your quick report, you can specify different fonts, font sizes, justification, styles, font colors and background colors. You can then apply these specifications to text, data, and summary calculations within rows, columns, or cells in the quick report.
To specify a character font, font size, style, justification or color:
- Place the mouse over the bottom right of the element you want to configure in order to display the button for calling the pop-up window; then click on it:
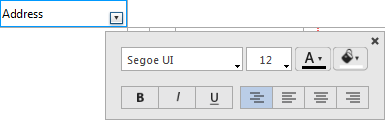
Note: The pop-up window can display additional options in its lower part based on the element being configured. - In the upper part of the window, choose the graphic property to be defined:
- font,
- font size,
- font color,
- background color,
- style,
- justification of contents.
4D applies the parameters to the text, data or calculations included in the selected area. You can define parameters for all report areas by selecting the pop-up button in the top left cell of the report design: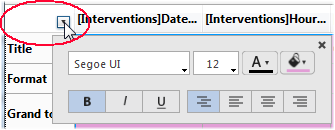
Note: Justification parameters are not previewed in the report area, but are applied in generated reports.
The Quick Report editor allows you to set an alternating background color for the report, which provides better readability for tables.
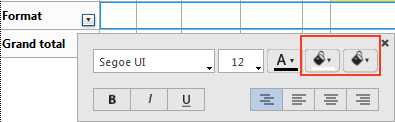
To set an alternating background color, display the pop-up window of the Format row and specify two colors to be used by means of the two background color menus:
Here is an example of a generated report (preview) that has alternating background colors: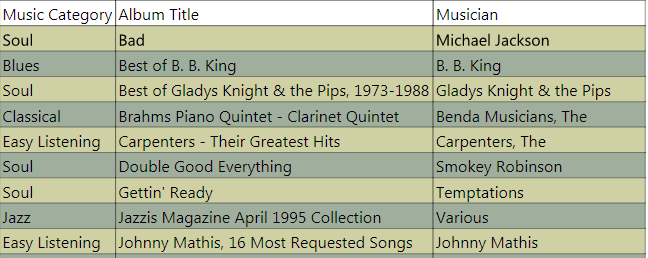
Background colors are also taken into account in reports generated in HTML format.
You can set the borders for cells in both cross-table and list reports.
To set the borders for a cell, a column or a row:
- Place the mouse over the element you want to configure in order to display the button for calling the pop-up window, then click on it:
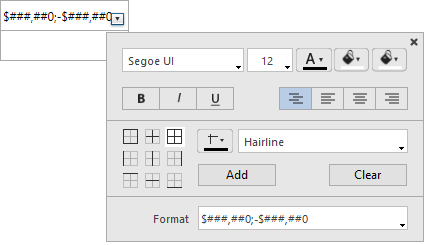
- In the border area, choose appropriate parameters:
- select the border configuration to set:

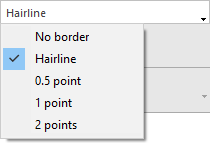
- select the line thickness:
- select the line color.
- Click the Add button to apply the border configuration to the selected element.
Each time you click the Add button, the current border configuration is added to previous configurations for the selected element (if any). The final result can only be seen when you generate the report. To remove all border configurations from the selected element, click the Clear button.

Product: 4D
Theme: Quick reports
4D Design Reference ( 4D v20 R8)


