
This is the legacy 4D documentation web site. Documentations are progressively being moved to developer.4d.com
 Sorting records and adding breaks
An important feature of the Quick Report editor is the ability to sort the records in your report. You sort records for two reasons:
- To view records in a particular order,
- To create groups of records and subtotal areas in the report for the purpose of reporting summary calculations for groups.
You can specify a sort order at any time using the pop-up window associated with the column header. You choose a sort order (ascending or descending) using the Sort Order menu of this window:
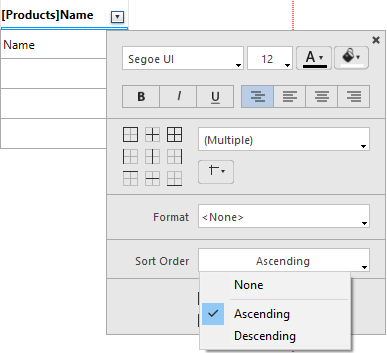
This works for columns containing fields or formulas:
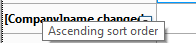
Once a sort is defined, a break row is added to the quick report. You can see the sort order at any moment by hovering over the break row header:
For more information about formulas, refer to Associating formulas with a quick report.
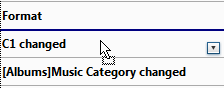
You can sort a report on several levels. Sort levels are displayed in order as break rows (subtotals) in the report design area. To change the level of a sort, you can drag and drop the break rows to move them up or down within the report design area:
You can delete any break level along with the associated sort of the column either by:
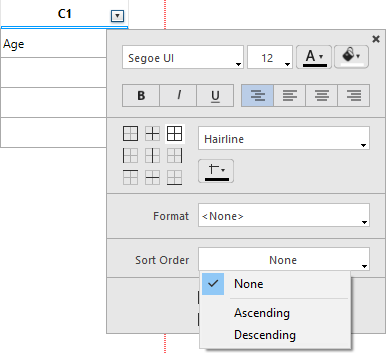
- choosing None in the "Sort Order" menu of the pop-up window for the associated column, or
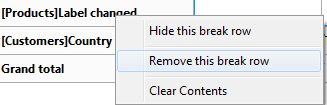
- selecting Remove this break row in the pop-up window for the row:
The break level is then removed. Note that in both cases, the column is no longer sorted. If you want to sort a column without adding a corresponding break level, you can simply hide the break row using the pop-up window (see Hiding rows or columns).
In a Cross-table report, the only values that can be sorted are the horizontal and vertical data sources (the two data sources that are used as categories in the final table).
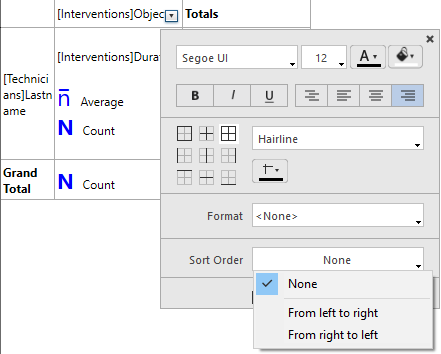
To sort the categories in a cross-table report, open the contextual window related to the category and select a value in the Sort Order menu of the pop-up window:
- select From left to right or From right to left to sort the horizontal data source:
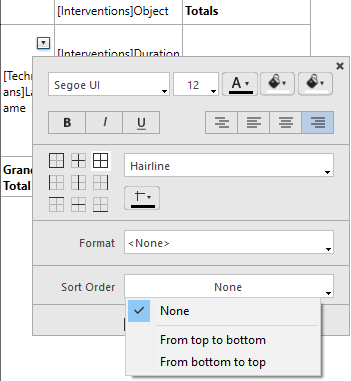
- select From top to bottom or From bottom to top to sort the vertical data source:
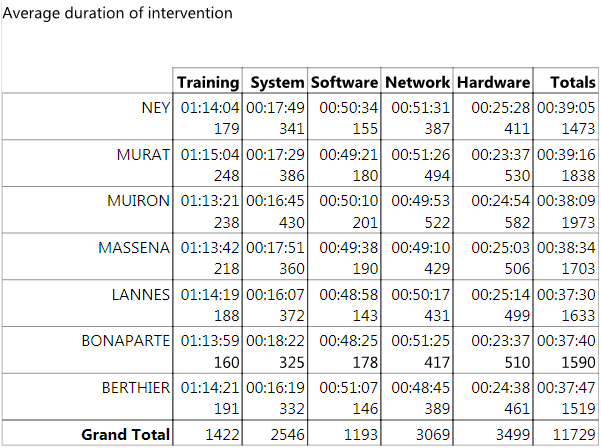
For example, the following cross-table report was sorted from right to left and from bottom to top:
In a quick report, you set break levels to separate or “break” records into groups according to values in one or more sort fields. A break area is printed at each break level. You can print summary calculations in the break area. The summary calculations — sum, average, minimum, maximum, count and standard deviation — are calculated for each group of records.
Break levels are determined by the sort levels and Break rows. For example, if you sort records by Sales Region, 4D inserts a break between each group of records that have the same sales region. These rows are automatically inserted when a sort is defined.
After you add a subtotal row to the quick report, you can request summary calculations on each break. For example, you can insert a summary calculation in a subtotal row to display subtotals for sales from each state in a marketing region. For more information about adding summary calculations to Subtotal and Total rows, refer to Adding summary calculations.

The label of a subtotal row indicates which change in value triggers the break.
You can improve the appearance and clarity of your reports by labeling each Subtotal row using the value of the Break field.
To request that the value of a Break field be printed in a label placed in the Break area, use the number sign (#) in the label. For example, the text “Total salaries for # department” will insert the department name (in this case, the value of the Department field) in place of the number sign when the report is printed.
The number sign does not need to be placed in the same column as the Break field. It will display the value of the Break field in any cell in the Subtotal row.
The following figure illustrates the use of the number sign in a label in the Subtotal row:
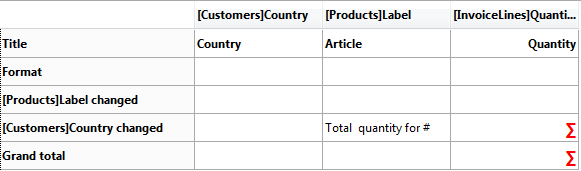
In the report generated, the following break row will be added to each country group:

You can configure subtotal rows in order to control the page layout and appearance of the quick report. For example, you can generate a page break after each subtotal. The subtotal page layout options can be used to visually set apart the different parts of the report.
To set the spacing for a subtotal row, select a subtotal row and open its associated contextual window or (included area) contexual menu. You have the following options:
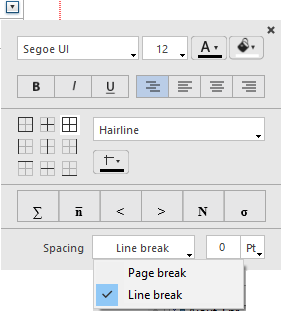
- Line break: A specific amount of space is added below each subtotal row in the report. An additional option is used to set the spacing mode:
- 0 pt or % (option selected by default): No specific property is applied to the subtotal row; it has the same spacing characteristics as the other rows of the report.
- Extra pt: You set a specific height of extra space in points.
- Extra % of height: You set the amount of extra space to be added as a percentage of the standard row height of the report. For example, to generate extra space corresponding to two empty rows, pass the value 200.
- Page break: A page break is generated after each subtotal row in the report.

Product: 4D
Theme: Quick reports
4D Design Reference ( 4D v20 R8)


